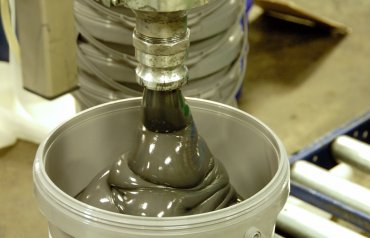
OLYMPIC VALLEY, California – Global production of lubricating greases reached 2.57 billion pounds in 2016, according to fresh data released by the National Lubricating Grease Institute. Thats 1.4 percent more than the 2.54 billion pounds recorded in 2015, and marks the second year in a row that grease manufacturing has nudged upward.
Tyler Jark, who serves as chairman of the institutes production survey committee, presented the results to the groups 84th annual meeting here on Monday. The production reported in 2016 is getting close to the peak year of 2013, when reported output came to just over 2.6 million pounds, he said. Its not quite there, but its very close.
Lithium soap-thickened greases, including both conventional and complex types, continue to lead the world market. They accounted for 75 percent of all greases manufactured in 2016, according to the NLGI Grease Production Survey Report, and production totaled 1.94 billion pounds, versus 1.88 billion pounds in 2015.
That slight uptick in share was not anticipated, because although lithium and lithium complex greases have led the global marketplace for decades, prices for lithium-derived raw materials have surged wildly over the past two years. Many expected to see lithiums grip on the market to loosen, not become tighter. I was a little surprised to see this slight increase, given all the cost and availability issues with lithium supply, conceded Jark, who is with Lubricating Specialties Co. in Pico Rivera, California.
He noted that the second most popular type of greases made in 2016 were based on calcium soaps, which contributed of 10 percent of global production, followed by polyurea greases at 6 percent, and aluminum complex greases with 3 percent. Various other types – using sodium and other metallic soaps, clay and non-soap thickener systems – account for the balance.
Looking at the regions that dominate grease production, Jark noted that China by far represents the largest chunk. In fact, with 899.6 million pounds churned out in 2016, China is almost surpassing all of North America and Europe combined, he said. North American grease production was reported at 462.6 million pounds and Europes at 475.3 million.

Photo courtesy of Axel Christiernsson International AB
This years survey collected data from 226 companies that operate a total of 250 lubricating grease facilities around the world. On a global basis, that means each of the participating plants produced an average of 10.3 million pounds of the stuff.
However, direct comparisons of year-on-year data should be avoided because the pool of reporting companies can shift from year to year. Seven companies that contributed data for 2015 production did not submit data for 2016, for example, but 10 new participants did turn in their volume data for those years, making the survey a robust picture of grease manufacturing activity.
Manufacturers are also asked to identify the type of base oil they use in making greases, and 88 percent of the participants responded with this data. From this we can see that the vast amount of production – 92 percent – still relies on conventional base oils, Jark reported. Four percent of the worlds greases made in 2016 (85.2 million pounds) were identified as being made with synthetic base oils, and another 3 percent as semi-synthetic. Respondents who answered this question also said they made a total of 11.3 million pounds of bio-based greases, or just 0.5 percent of all reported volumes.
Jark stressed that the survey is conducted under rules of strict nondisclosure by the independent research and consulting firm Grease Technology Solutions. Respondents voluntarily supply their production data directly to Chuck Coe of GTS, who compiles the answers and composes the report, he reminded. No one at NLGI ever sees or has access to individual company data, only the aggregated results.
The full 30-page report of 2016 grease production includes prior-year data going back to 2013, and will be available to download by the end of June at www.nlgi.org. NLGI member companies will be able to obtain a secure PDF of the report at no cost, while non-members will pay a fee to get it.
Wrapping up, Jark announced that the full report also will be made available, on a paid basis only, in an Excel format that allows users to sort the data and track trends by region, year, thickener type and other parameters.